


After I labeled 700 EN → CS translations manually and confirmed my initial gut feeling that “hmm, this is probably fine” is a risky mindset, I needed a repeatable benchmark to measure changes objectively over time.
Using automated translation in a product has everyone asking the same stingy question: how do I know this is any good? Well, “the UI looks OK” until it doesn’t. The moment you tweak a prompt, switch an engine, update glossary terms, or add a QA rule, things can go sideways. So, I built a reference benchmark set that’s stable while things move around. I call it the “Golden Dataset”.
My Golden Dataset is basically a fixed, representative set of SaaS UI strings that I can reuse as a benchmark long-term. I now use it at Localazy to evaluate changes in translation and QA.
Note: Data privacy is crucial. This post displays only aggregated distributions and redacted UI visuals.
Quick definitions: In this post, MT = machine translation outputs. QA = checks and scoring applied to translated output. Microcopy = 1-19 characters. MQM = Multidimensional Quality Metrics.
1) What the data looks like
First, I thought about translation risk (before defining any targets) and the distributions that shape that risk. These were: text length, domain mix, and which language pairs matter most in practice.
Our customer mix is software-heavy
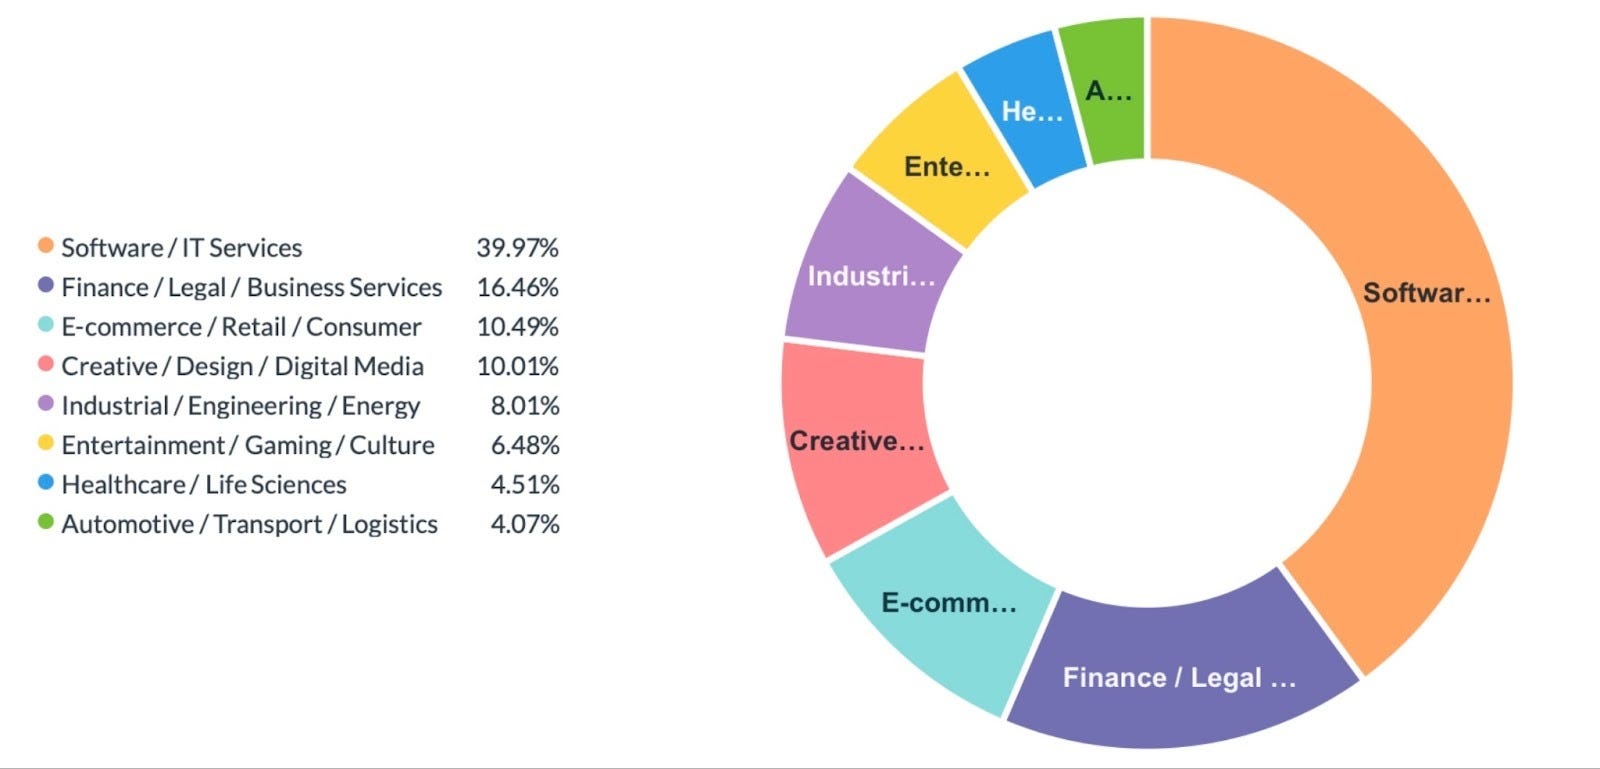
In a CRM snapshot of HubSpot companies with Localazy IDs (a few thousand companies), IT and software services dominate. I grouped them into eight stable buckets, as you can see in the chart.
Why does this matter? Because the domain affects what “good” sounds like: tone, terminology, and register expectations change between (for example) a dev tool and a fintech onboarding workflow. I don’t need a perfect taxonomy for a benchmark. I do need stable buckets so the dataset remains the same when labels change.
Short UI strings prevail
Over the tens of millions of production segments grouped into text-length bins, short strings are the norm:
TXT-XXS (1-19 chars): 44.8894%
TXT-XS (20-39 chars): 25.2224%
TXT-S (40-249 chars): 25.0714%
TXT-M (250-899 chars): 4.4490%
TXT-L (900-2499 chars): 0.2836%
TXT-XL (2500+ chars): 0.0842%
To keep terminology consistent in this post:
Microcopy = TXT-XXS (1-19 characters). That bin alone is 44.8894%.
Short strings = TXT-XXS + TXT-XS (under 40 characters): 70.1118% combined.
This is why I didn’t want a hand-picked, “clean” dataset. UI translation fails on fragments, labels, and conventions, often in ways that still render normally, but feel wrong.
A few MT language pairs dominate the volume
For v1, I used English as the source language. In the MT language-pair distribution (machine translation by language pair), demand concentrates into a few pairs, then drops into a long tail.
The top pairs include:
English → French: 32.111%
English → German: 8.974%
English → Spanish: 7.413%
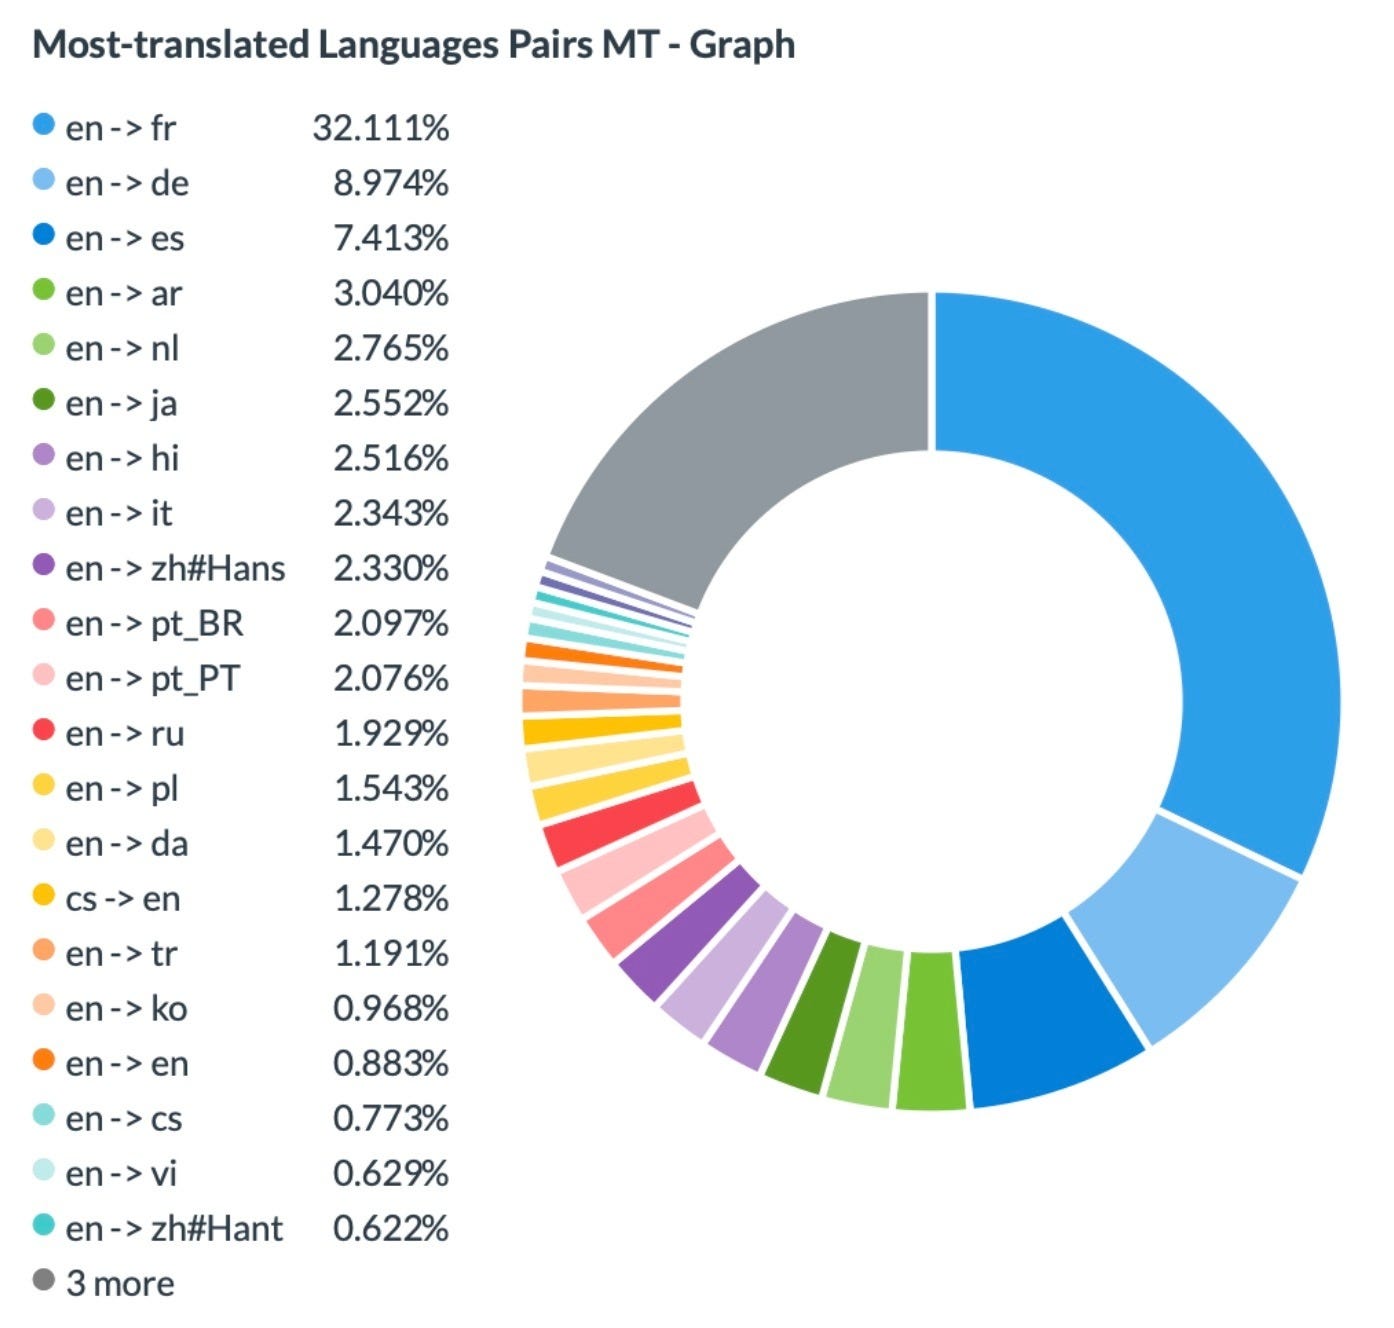
So, domain buckets, length bins, and MT language pairs are what “representative” should mean for the Golden Dataset.
2) What should be in the dataset
Note: In this section, percentages are sampling targets for the Golden Dataset (let’s say design choices). They’re not MT usage shares. Also, the v1 labeling pilot described later is based on EN → CS output (section 5 describes that pilot only).
It’s not possible for a Golden Dataset to cover every language, domain, and string type while still being maintainable. So, I designed v1 so that it’s stable and useful for repeated experiments. I defined coverage in three dimensions: language pair, domain group, and text-length bin. It’s a simple recipe: (language pair) x (domain group) x (text-length bin).
A) Language-pair targets (v1)
These are the language-pair sampling targets for v1:
20% English → French
10% English → German
10% English → Spanish
10% English → Italian
Then, 5% each:
English → Dutch
English → Arabic
English → Polish
English → Chinese (Simplified)
English → Chinese (Traditional)
English → Japanese
English → Hindi
English → Portuguese (Portugal)
English → Portuguese (Brazilian)
Then:
3% English → Korean
2% English → Vietnamese
Note: If extraction uses language IDs, variants must be handled or the dataset drifts.
B) Domain-group targets (v1)
HubSpot’s raw industry labels are noisy, so I collapse them into eight stable buckets and use rounded targets (so small buckets don’t disappear):
40 / 16 / 11 / 10 / 8 / 7 / 5 / 3 (same order as the eight domain groups from section 1).
C) Text-length-bin targets (v1)
Length affects both error probability and error type, so v1 requires explicit bins while keeping TXT-XXS as the largest single bin:
40% TXT-XXS
30% TXT-XS
20% TXT-S
5% TXT-M
3% TXT-L
2% TXT-XL
These targets are intentionally close to production shape, but still force coverage of longer strings.
3) Using proportional stratified sampling and SQL to extract about 1,000 segments
Once I established targets, I didn’t want to pick strings by hand, because I’d end up picking ones that are easy to judge, easy to read, or might include context (the opposite of what I need a benchmark to provide). Instead, I need something that looks like production. It should include the short, tedious UI fragments that still “render OK” even when the translation isn’t right.
So, I pulled the set with proportional stratified sampling in SQL:
turn the sampling targets from section 2 into counts per bucket
sample within each bucket so the final dataset matches those counts (roughly)
don’t over-optimize ratios, but keep it close enough to be comparable
For example: If the dataset is about 1,000 strings and I’m using sampling targets (not usage shares), then a bucket like (English → French) x (Software/IT Services) x (TXT-XXS) gets around 1,000 x 0.20 x 0.40 x 0.40 (approximately 32 strings).
In the dashboard, the “Extraction” table ends up at about 1,000 rows. I consider that as v1’s “about a thousand strings” snapshot. That’s big enough to see patterns, and small enough to rerun whenever I change an engine, tweak a prompt, update a glossary, or add a QA rule.
I didn’t make this very strict, because the goal isn’t perfect matching. The goal is: nothing important disappears, while TXT-XXS stays the biggest bin. If I publish that at some point, there won’t be raw strings, and it’ll be aggregated.
What is “Golden” about all of this, exactly?
The “gold” part is: the same source strings each time, plus the metadata that puts each string in the grid (text-length bin, domain group, target language/pair). What changes is what I run: engine/prompt/glossary/QA rules. The differences come from the system, not the dataset shifting.
Note: for publishing, there will be no raw strings or table rows from the extraction view.
4) Labeling: start with EN to CS and then build a tool
Sampling is the easy part. As for labeling, I ran my first “human” labeling in English → Czech (EN → CS), so labeling stays consistent in-house. For steadiness across tons of short UI strings, I split the set into domain-aligned projects (same domain groups as the sampling buckets), so each group had its own lightweight style guidance and glossary notes. That way, I wasn’t judging, for example, fintech strings with the same expectations as dev-tool UI.
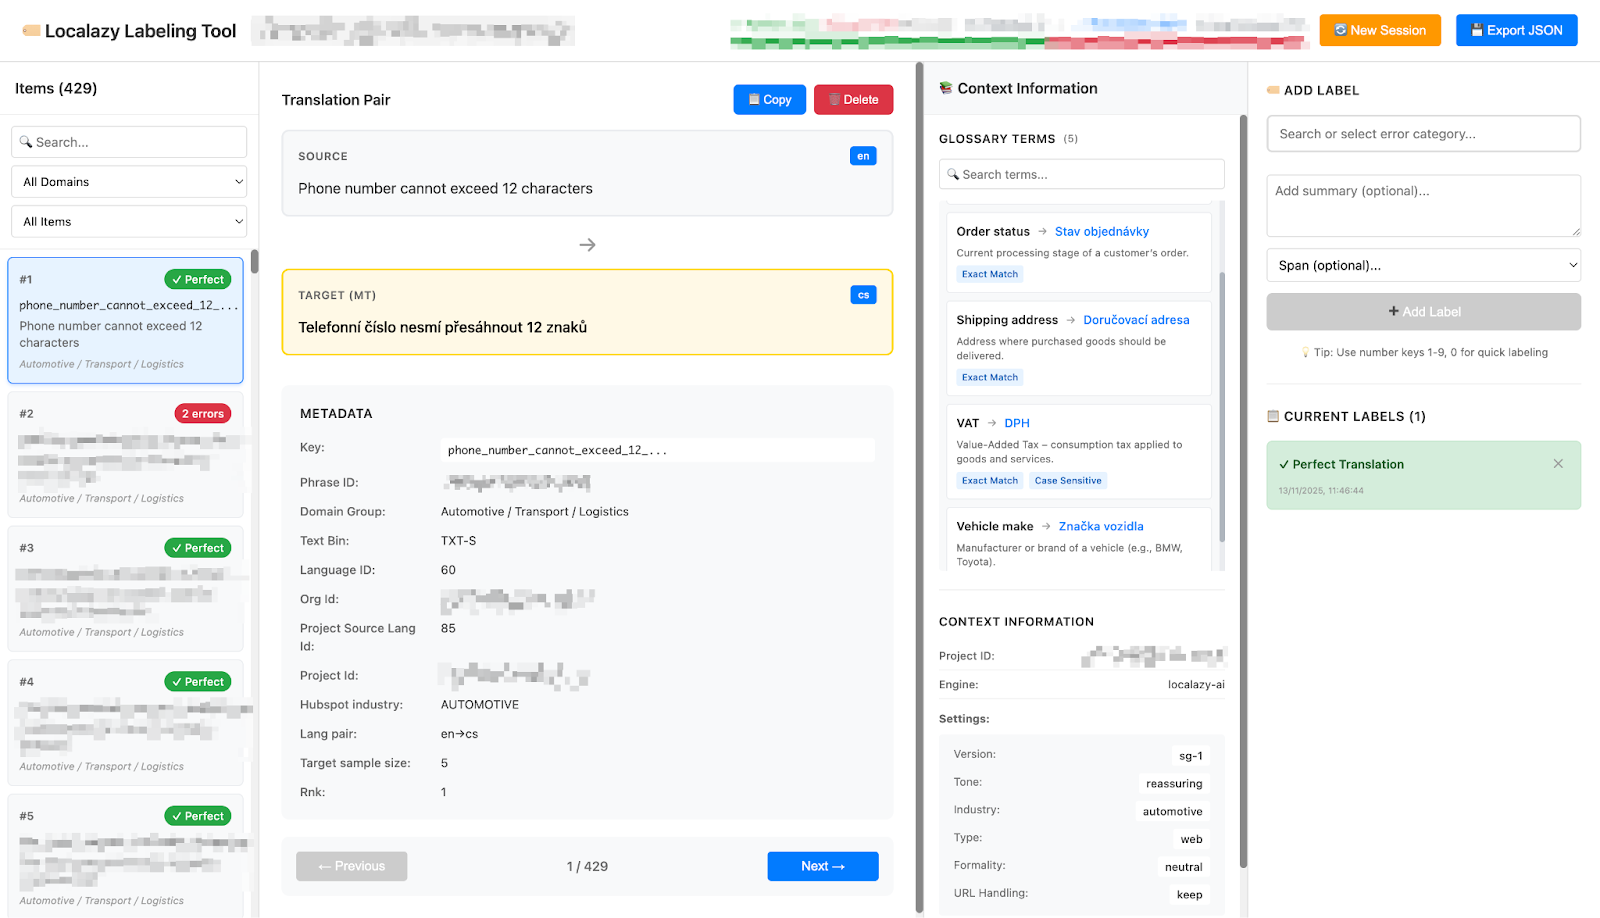
I also built a small internal labeling tool. It shows the source and output for each string, and domain group and text-length bin are visible. With it, I can also tag problems using MQM-style categories, plus severity. The tool also exports labels in an organized format for later analysis and reuse.
In v1, the labeled subset contains 700 strings. There, “Positive” means I didn’t mark any issues for the string (in severity terms, that’s “no_error”).
5) What the labeled patterns revealed, and what I’d do in v2
Note: This section anchors on the 700-string EN → CS labeling pilot, not the Golden Dataset overall.
Once the pilot was labeled, I felt a sense of relief: I had proper, trackable distributions.
For the error categories (MQM-style dimensions), Style & Fluency is the largest bucket (36.14%). Positive is 33.86%, followed by Accuracy (18.86%) and Terminology (8.29%). Warning (1.86%) and Locale & Formatting (1.00%) are tiny, but still worth monitoring.
Severity-wise, no_error is 33.9%, but high is 24.0% and critical is 17.4% (medium is 14.6%, low is 10.1%). This mix changes priorities. A few high-impact failure modes are more important than treating lots of tiny ones.
Priorities change again when I weight issues by severity. Semantic Error (36.1%) leads, followed by Unnatural Phrasing (32.6%). Word Order Error (4.9%) is also a recurring item.
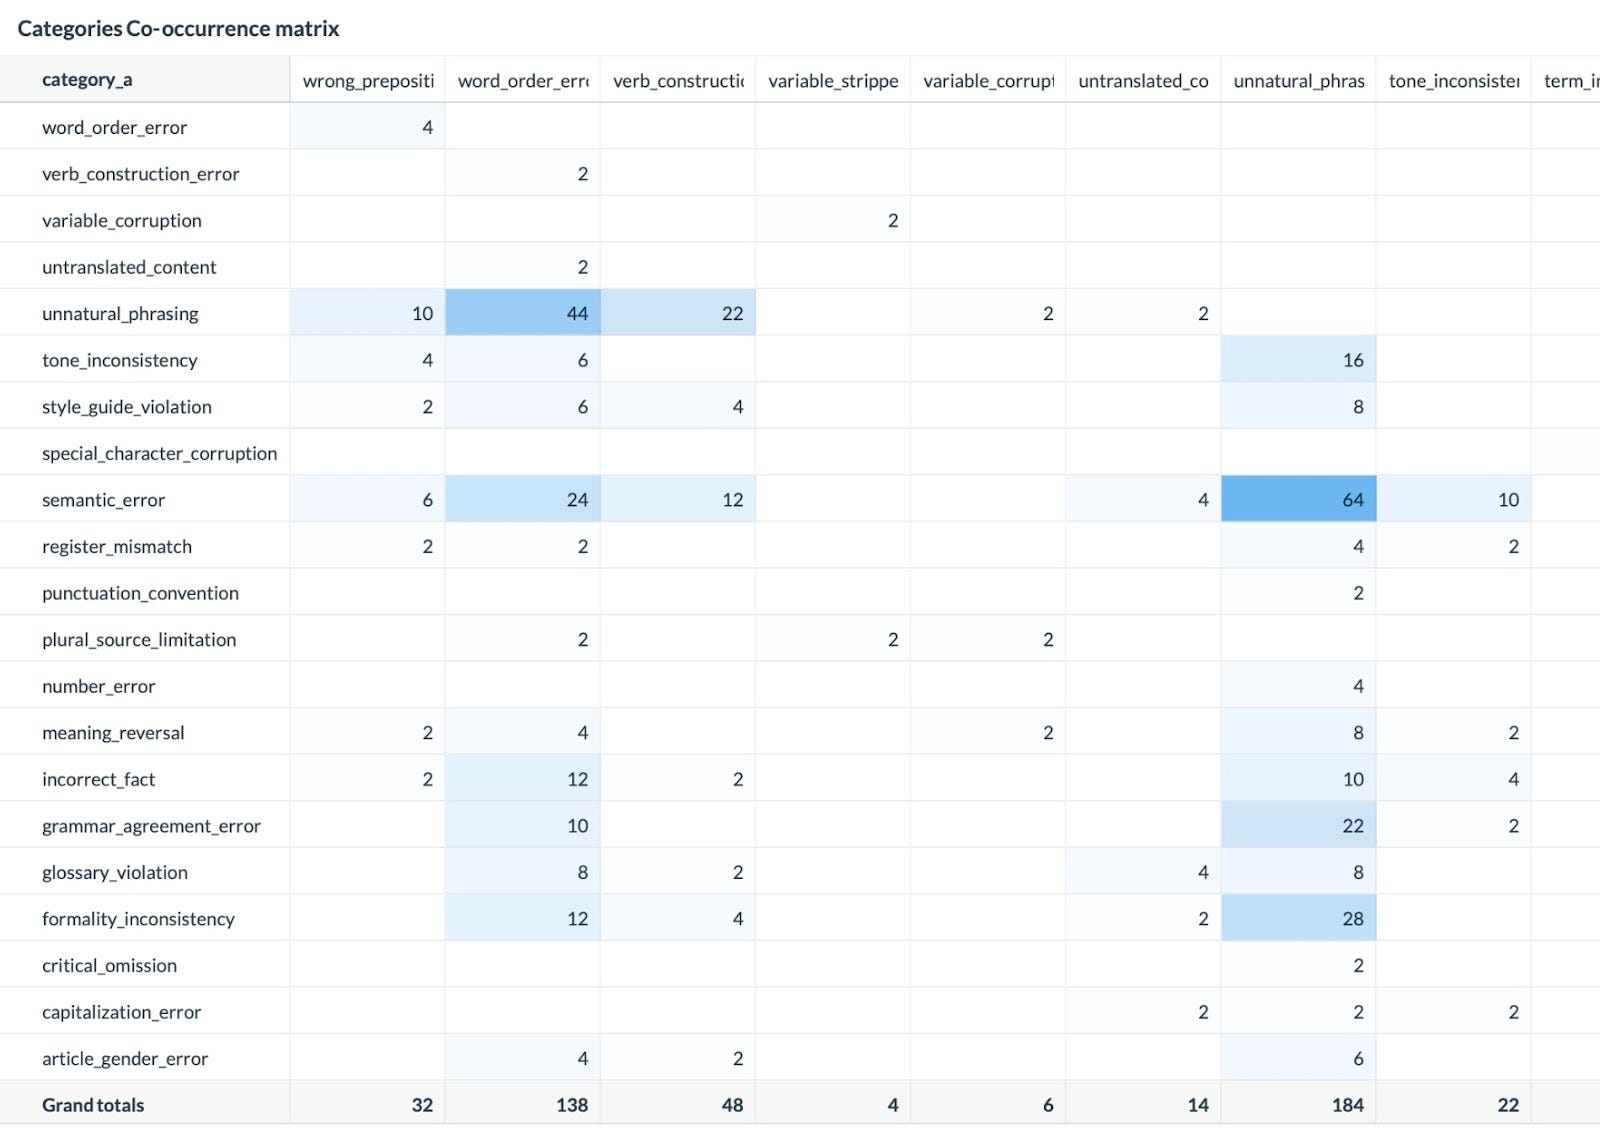
As you can see above, the co-occurrence view is very practical for engineering. For example, I’ve found Unnatural Phrasing paired with Semantic Error, Word Order Error, or Formality Inconsistency. That tells me to develop checks that pinpoint bundled patterns instead of looking at every label as an isolated problem.
For v2, I’d keep:
The “recipe” (language pair x domain group x text-length bin). TXT-XXS should be the largest bin.
Stratified sampling with clear targets (stable, rerunnable, easy to reason)
MQM-style labeling and severity
For v2, I’d change:
Expand labeling by starting with the highest-demand ones from the v1 list
Add more context signals for strings where context is the entire problem (microcopy is the main issue)
Make labeling directly connected to QA work: label → check → measure again on the same dataset
Final remarks
To conclude, v1 definitely meets my core goal: replacing “looks OK” with a repeatable benchmark directly connected to real product text.
With the Golden Dataset, I can now compare changes in translation and QA against a stable baseline to catch problems early. I’m working on expanding labeling beyond EN → CS and using the same workflow for new QA checks before they go live.